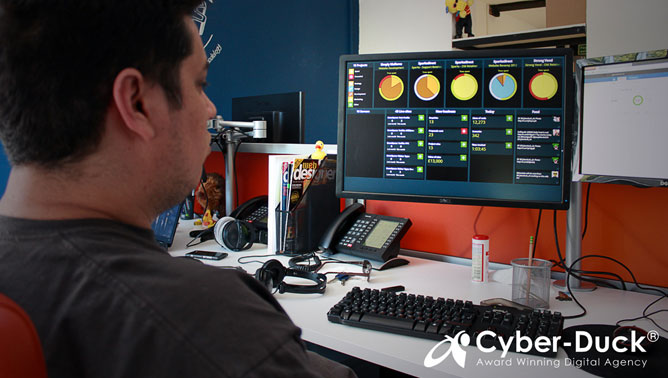
To recap, on the weekend of the 26th and 27th of May 2012, Cyber-Duck team members Gareth Drew, John Hamelink, Ramon Lapenta and Sangheethan Subramaniam arranged and took part in our first official QuackHack, a UX/coding "hackathon" which focussed on designing and building a BI Dashboard that collates data from a number of sources.
The Opportunity
Within our business we identified the need for a comprehensive dashboard that gathers real-time (live) information about time spent on projects, website performance data, who is working on what, which developers are committing code and other social media activities. We fantasied about having one large and sexy 55% LED screen where this is all possible.
The Proposal
Build a dashboard that amalgamates all the data drawn from the different analytical programmes we frequently use. This would be automatically updated and displayed to the whole team. The dashboard would be designed so that all the "top level" relevant data is shown with user-friendly infographics, enabling Cyber-Duck to easily analyse and compare projects.
The Solution
The dashboard was built via APIs about: cloud server health using CloudKick, website marketing data from Google Analytics, time spent on projects via GetHarvest and new business levels/conversions and client signature status from HighRise and Echosign. They also included a visual counter for the number of code commits on BitBucket. To develop the dashboard the team used a MySQL relational database Sublime Text 2, on a Sass console.
 |


