The CrimeTimeline was created by the Cyber-Duck team as part of the Spring Hackathon, hosted on Google Campus in London. Within just 30 hours of programming, "Team Awesome" managed to plan, design and build a fully functional application which displayed crime levels throughout the UK, using an interactive heat map.
We created a web app that utilised the Police UK API, displaying levels of crime throughout the whole of the UK using heat maps. Including a scrolling timeline, users can see how volume of crimes and the crime severity fluctuated throughout the UK over the last 3 years.
For the user that wants a quick snap shot of the area, the app included the ability to open a pop up menu with a breakdown of all crimes within a 1 mile radius. The aim of the app was to educate the community on crime levels in their area.
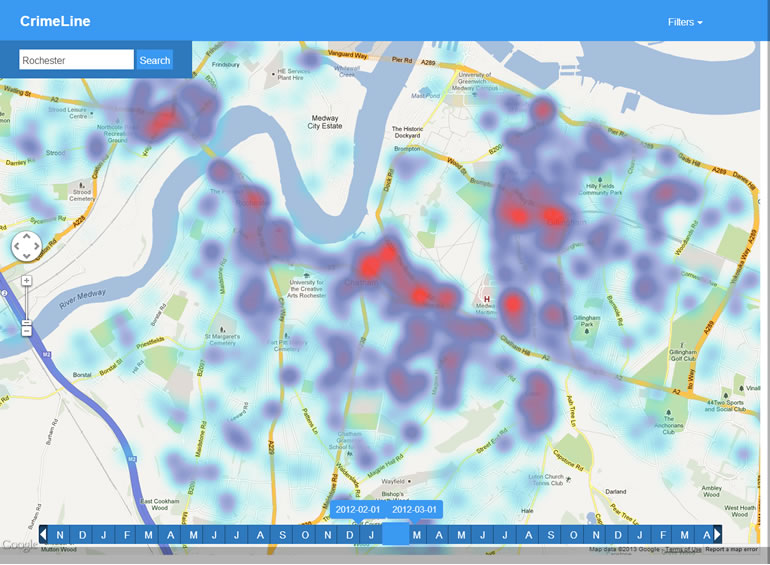
The CrimeTimeline shows you the levels and severity of crime anywhere in the UK.
Technologies used:
- Laravel 4 Beta
- MySQL
- jQuery 1.9.1
- HTML5 Boilerplate
- Sass
- Police API
- Google Maps API
- Open Street Maps API
Challenges
Within the allotted time limit of 30 hours there were numerous challenges we had to overcome. For instance, there were some APIs that we initially found ourselves unfamiliar with including the Police API and quickly had to learn how it worked. We also tried generating the heat map from downloading the Police UK API data using the CSVs but experienced some issues with rendering the vast amount of data when zoomed out on Google Maps. There was a steep learning curve we overcame when understanding how to overlay heat maps on top of the interactive Google Map. Finally, we decided we wanted to be able to provide an extra click or tap that would provide specific data about the type of crime in the form of visual nodes, which in itself was a complex feature to include.
How the app works
The data our team used to generate the heat map was asynchronously pulled from the Police UK API. This data is constrained by a bounding box which is defined by the current viewport of the Google map.
For the search, we used Open Street Map’s geocoding API to return the longitude and latitude of a location, which moved the map to the correct position. The app then reloaded the heat map with the data for that area. The team also leveraged the API’s ability to filter the results by crime type. For this we also added a crime filter menu so the user can remove certain crimes from the map, meaning they can research specific crimes in particular areas. For example it is quite interesting to see the hot spots for shoplifting around shopping centres and anti-social behaviour around pubs and clubs. To solve the click and tap feature where categorised crime data is visualised in a specific area, we created our own JavaScript library that allows this to happen.
Result
Everyone was very impressed with the end result. The fully interactive map allows users to search for crime in their area and filter by violent crime, burglary, vehicle crime, drugs, anti-social behaviour and more. The heat map displays insightful data that educates the public about crime in any area within the UK. The interface also allows users to scroll through months of the year to retrospectively whilst learning about the changing crime patterns where they live. Due to the relentless efforts and dedication to the project, CrimeTimeline by Team Awesome from Cyber-Duck won the award category for best use of geographic data, winning a Fitbit Zip wireless activity tracker and a Raspberry Pi. It has also been showcased in industry leading .Net magazine, for the teams innovative use of Javascript.

Team Awesome living up to our name!
Roadmap
Under the DuckLabs banner, Cyber-Duck are now in the process of making numerous improvements including enhancing the way users search through time by changing the labelling and the graphics on the horizontal slider so that all buttons are based on numerical values. We are planning on reviewing how the national data is processed as the user moves around the map, specifically to speeding up efficiency on client-side (web browser) processing. Further changes to the search results are also in the works where an auto-complete dropdown is presented. We are also in the process of approaching the police to see if they would be interested in promoting the project to the general public.