The modern world is a data-rich one. The trick to succeeding in it is knowing how to use all that information effectively to make better choices for your business. I explore how the brightest companies are utilising data to succeed in today’s data-rich world.
While it may seem like data is a new phenomenon, inextricably linked to computer technology, it has been around for millennia. After all, data is just recorded sets of information and content that enables users to make insightful decisions and conclusions.

The Cave of Beasts features some of the oldest examples of human data in the world – cave paintings.
As an example, Egypt’s Cave of Beasts dates back 7,000 years and showcases over 5,000 paintings of animals and humans interacting with one another. These paintings are some of the earliest signs of recorded data, providing evidence of the domestication of animals and the beginnings of human civilisation.
But just because we’ve been recording data for millennia, it doesn’t necessarily mean that we’ve produced a lot of it. From the dawn of civilisation 10,000 years ago until 2003, humankind generated just five exabytes of data. Sounds impressive, right? But to put that into context, today we generate five exabytes every two days, and the pace is accelerating.
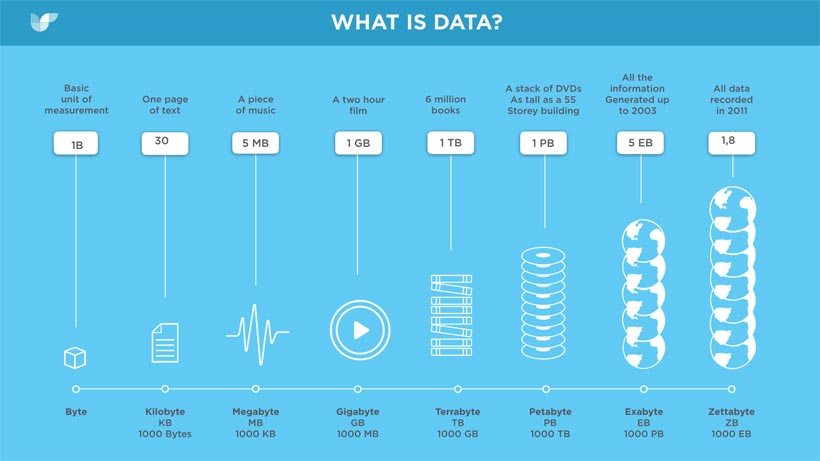
In the modern world, we produce more data than ever before, and everyday sees us generate even more than the previous day! In 2011, we produced 1.8 zettabytes of data, or 1,000 exabytes.
With so much data available, companies the world over are using innovative methods to conduct their business and ensure success. To many, data is the new oil, and its effects on a company’s value are astonishing. But, just like oil, it isn’t how much you can collect that brings prosperity – it’s about how you use it.
Data Is the New Oil
In April 2017, Elon Musk’s Tesla overtook General Motors to become the world’s most valuable car manufacturer, reaching a value of $51.54bn to GM’s $50.22bn. This is even though GM sold 2.3m vehicles in Q1 of 2017 compared to Tesla’s comparatively meagre 25,000 and that Tesla has never actually made a profit: just last year, Tesla lost $773m while GM saw a profit of $9.7bn.
And why did Tesla do so well on Wall Street? To paraphrase the great slogan: It’s the data, stupid.

Oil companies used to run the world, but many believe the future lies in data. Image credit: David Parkins, The Economist
Tesla is at the forefront of self-driving technology. Its Autopilot feature, which all models including the Model 3 can run, can collect up to 100 gigabytes of data every second. Cumulatively that’s a lot of data, all of which Tesla is using to refine its self-driving capabilities. Investors view this as signs the company will go on to revolutionise the automotive industry.
As we can see, with such abundant data available, the opportunities for extracting useful information businesses and individuals can use to make insightful and profitable decisions are immense. The most innovative entrepreneurs know that data paves the way to the future.
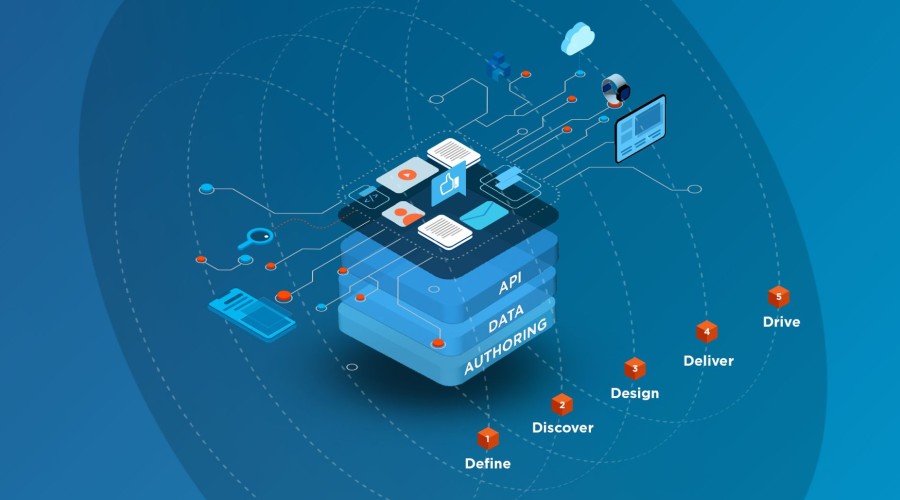
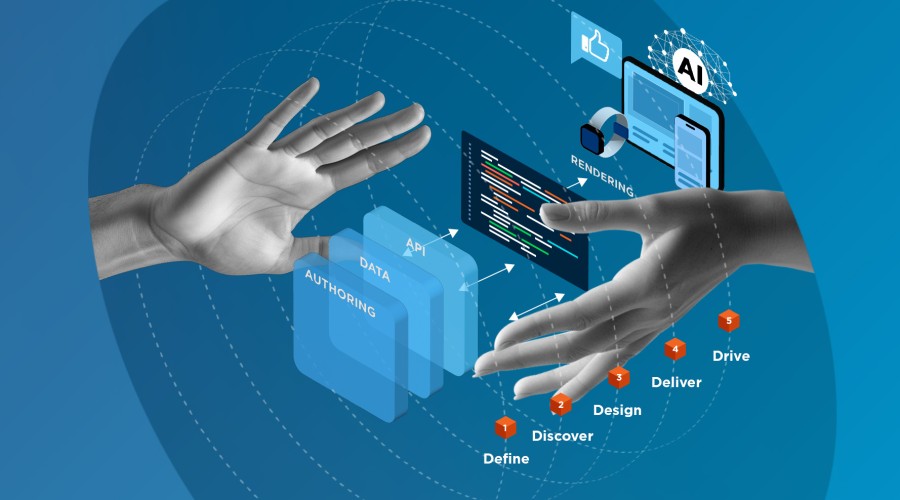
But finding a way to analyse all that vast data to inform your design may not be so easy. This brings us onto the concepts of small and big data: what are the benefits and issues of each?
Big Data vs Small Data
As you can see below, the difference between big and small data is where they focus.
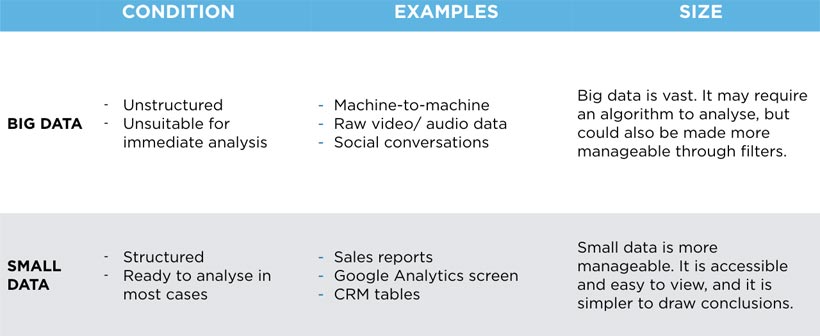
WHAT IS BIG DATA?
Big data, by its nature, is unstructured. Although it is sometimes collected with a specific purpose in mind, quite often it isn’t. CIOs struggle with big data because they are ill-equipped to deal with the sheer volume their systems collect. To draw meaningful insights CIOs need to understand what the data is and how it can benefit their organisation. Once they have done that, they will need to either create functionality or algorithms to process the data or try and use turnkey tools.
Most enterprises are years away from getting the full value out of their data assets. There is of course a human and financial toll on this type of big data analysis so organisations should decide the cost-benefit ratio before they embark on extensive big-data analysis projects. Some companies, like Crimson Hexagon, help organisations process and distil heaps of social media ‘big-data’ by providing turnkey functionality to search it and sort it into logical insights.
WHAT IS SMALL DATA?
Small data, on the other hand, is collected for a purpose and is ready to be analysed right away. It’s therefore both cost and time efficient, yielding insights almost right away. It’s also more likely to help you understand why something has occurred.
In addition to the ongoing polarisation between big and small data, there is also quite a lot of confusion between qualitative and quantitative research. Quantitative research will discover the who, what, when and where of data, and it is statistically driven. Meanwhile, qualitative research provides anecdotal and in-depth answers that show the why and how.
THE DIFFERENCE BETWEEN QUANTITATIVE AND QUALITATIVE DATA
I think the biggest problem with quantitative data is that it can encourage us to forget what’s behind every conversion. It’s a human being who is searching for something useful, or wanting to complete a goal. The research will reveal where a person is and what they do, but not why they do it or what they find frustrating. Qualitative research can rectify this. It is vital to use both qualitative and quantitative research to understand both the ‘what’ and the ‘why’.
WILL THE FUTURE OF DATA BE HYBRID?
Most successful marketers use a combination of quantitative tools and methods and qualitative research to draw meaningful insights. Tools like those provided by Crimson Hexagon allow marketers to sift through heaps of ‘big-data’ such as social conversations. They can then understand purchase intent and user sentiment on a mass scale to generate ideas and draw insights.
How the Pros Use Data in Design
This is the perfect time to discuss Netflix, the online streaming Goliath. Netflix is one of the masters of data-driven design when it comes to the way it creates and markets its products.
They conducted a range of consumer research studies and found that users spent 82% of their browsing time on its platform sifting through images. The human brain can process images in as little as a jaw-dropping 13 milliseconds. Finding the right cover art to promote shows is paramount.
Nice guys finish last! Netflix found that villainous characters outperform the do-gooder during user research about cover art. Image credit: Fast Company
By A/B testing cover art – presenting users with either a control or variant image at random to see which produced the most conversions – Netflix found that their users responded better to close-up shots of characters’ faces than other images. Similarly, villainous faces displaying complex emotions outperformed stoic expressions. There were also cultural and demographic differences between users.
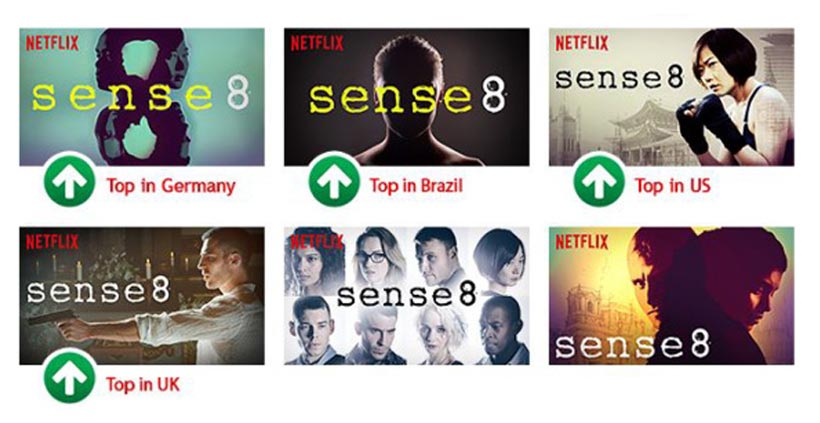
Netflix also noted cultural variations in their user research. Now, you’ll see different artwork depending on where you live and what culture you’re from. Image credit: Fast Company
Netflix’s research has led to a revolution in how they present content to their users. Now, what country you’re in and what your cultural heritage is will affect which artwork you see. For instance, with Sense8 Netflix conducted a range of A/B tests to see where artwork performed best. A limited amount of users were tested and the images that encouraged the most conversions were later rolled out to the rest of the population.
With every new finding, Netflix refined its design. Invariably, its conversions and sales skyrocketed – from 36m subscribers in 2012 to nearly 100m in 2017. This is one of the most successful instances of how a company has used data to improve its services.
Next Time with Data-Driven Design
Now we’ve illustrated the types of data that’s out there, next week we’ll start looking at the ways you can utilise data to ensure success. We’ll show why it’s important to know your data and how you can get to grips with it, before delving into the nitty gritty of how you can design your platforms with data at its heart.